

What is a histogram? Histograms can be your biggest advantage once you understand what they are. In this tutorial we explain how to you use your camera’s histogram to get the best exposure possible.
Your camera’s histogram provides a much more accurate method of judging whether a shot needs more, or less, exposure. It’s not just used for judging exposure, however: the position and shape of the histogram’s graph may also inform you of the contrast of the lighting in a scene.
Below we’ve confronted some of the frequently asked questions about histograms so you can get started using these graphs to avoid poor exposures.
What is a camera’s histogram and do I need to use it?
In sum, the histogram is a kind of graph that you can bring up on your digital camera’s rear LCD so that you can assess the tonal distribution of the images you take. The histogram provides a method of mapping the exposure of a digital image; by looking at the graph, you can tell whether or not a shot too dark or too bright.
Pixel brightness is displayed on the histogram’s horizontal axis, ranging from pure black on the left to pure white on the right, with the full range of mid-tones in between. On the vertical axis, the histogram displays the number of pixels at a particular brightness level.
How do I view my camera’s histogram?
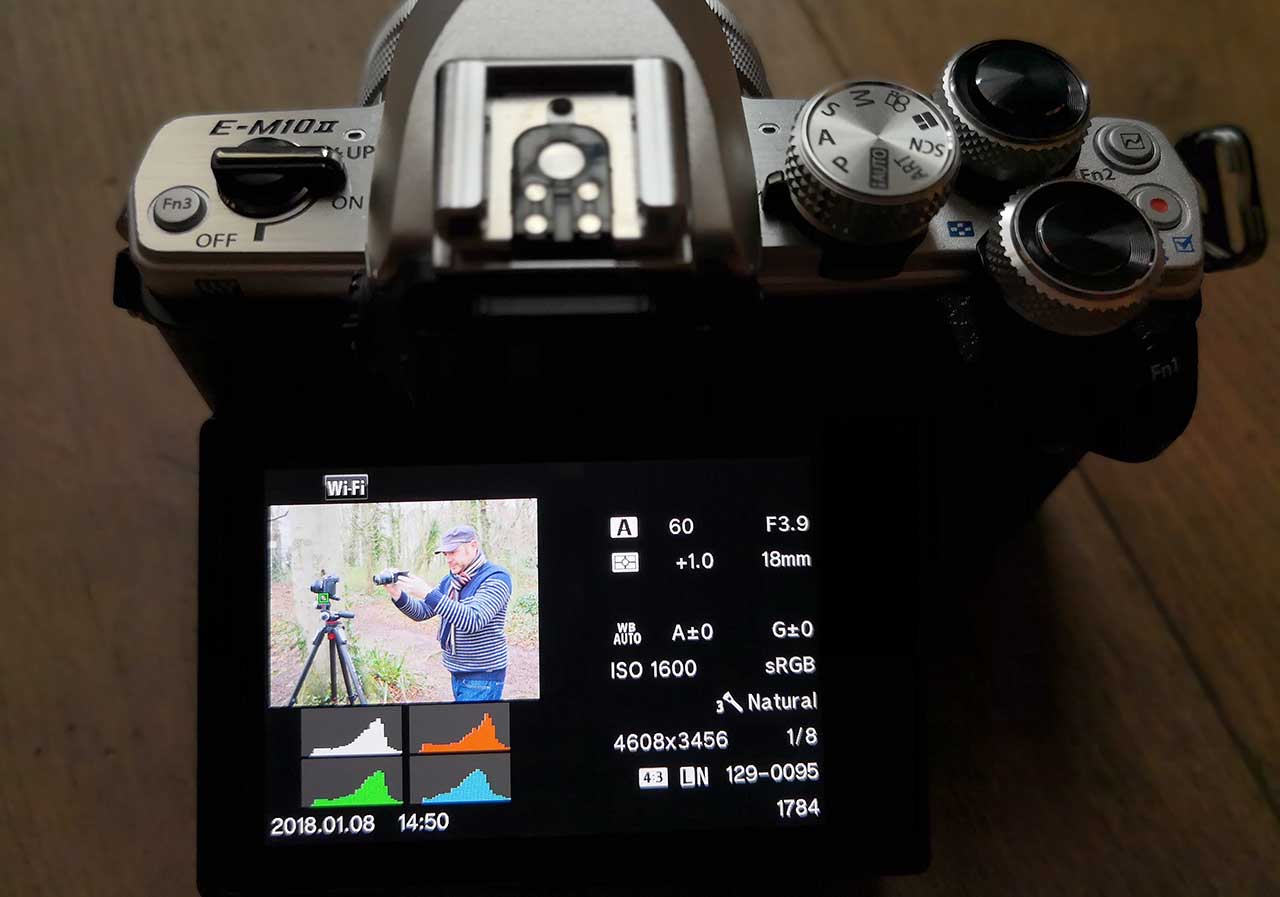
There are a couple ways. One way is to look at your histogram after you’ve taken a picture, when evaluating the shot on the camera’s LCD screen. Typically in playback mode you can toggle through a series of display options, one of which will show you that image’s histogram reading.
On Canon DSLRs, for example, press the Play button, then press the Info or Disp button to display this option. On Nikon DSLRs you can use the up arrow on the joypad during playback to toggle through the display options. On other cameras the process is similar.
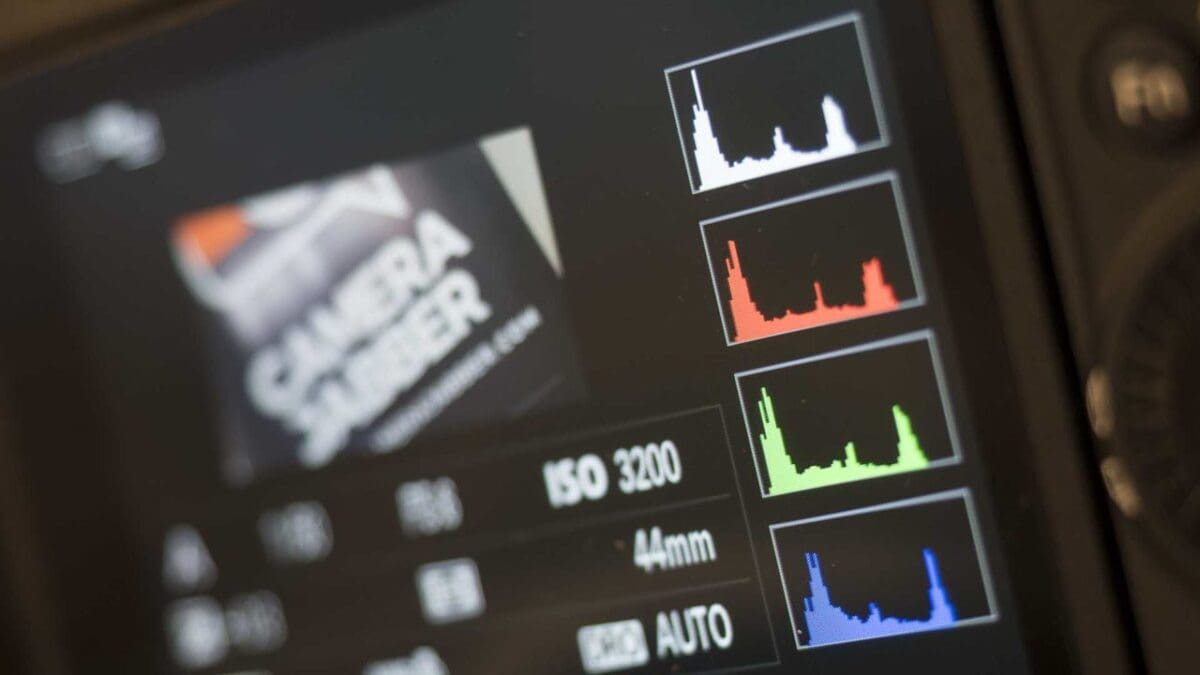
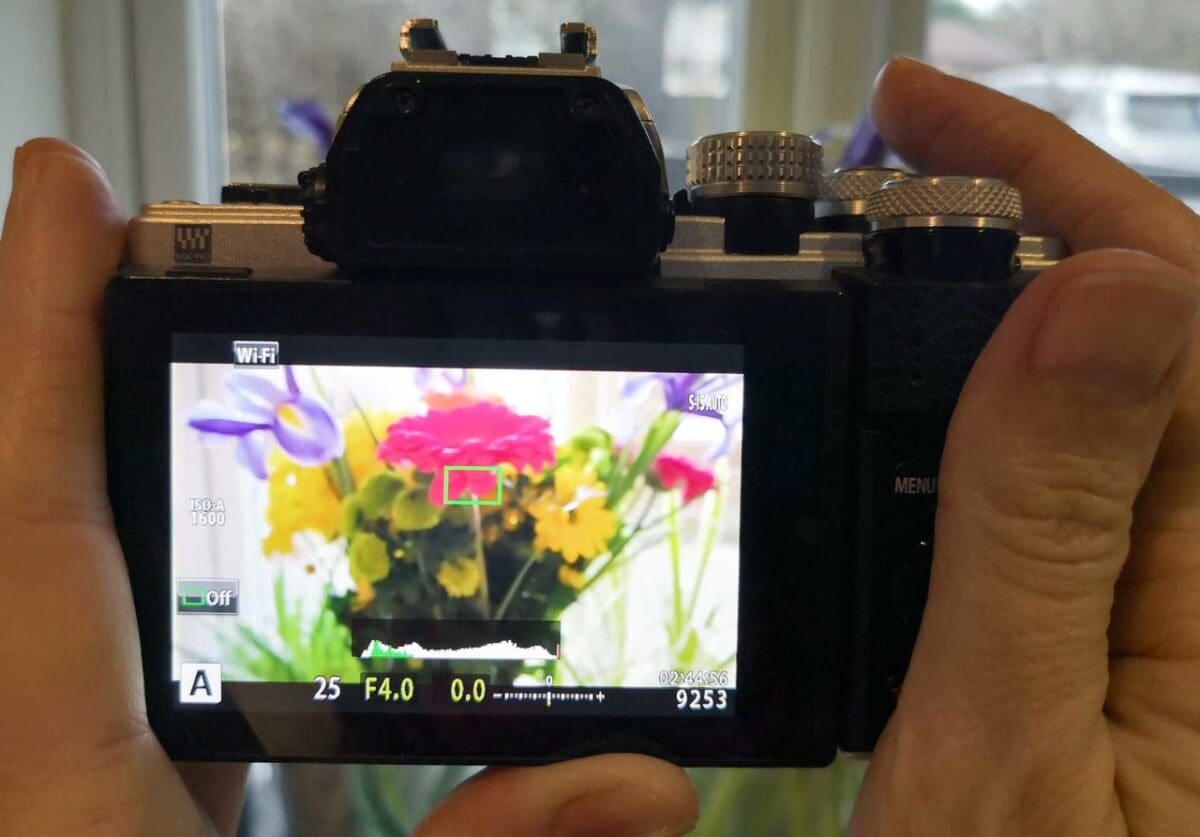
The other way is to view your histogram in Live View at the shooting stage. Again, if using an interchangeable lens camera, DSLR, bridge camera or premium compact camera, you should have a button on the back that allows you to change the display options on your LCD in live view. One of these should reveal the histogram showing your scene’s exposure graph, such as in the image above.
What is a histogram showing me exactly?
The histogram gram displays the brightness of all the pixels that comprise the image. The x-axis, or bottom line, displays the brightness, while the vertical y-axis displays the number of pixels.
In the interest of simplicity, the units and numbers are not displayed on the graph. The key points about the histogram you need to remember is that the right-hand side of the graph shows the brightness tones, the central part shows the mid-tones, and the left-hand side shows the darkest tones.
What shape should I aim for on my histogram?
The shape of the graph greatly depends on what you are taking pictures of. Snowy scenes, for example, will produce a histogram that should peak towards the right side of the graph due to all the bright tones.
Typical subjects that have average distributions of tones will ideally have a graph that gradually rises from the far left outside, peaking somewhere in the middle, and then falling away little by little until it has fallen to zero at the far right-hand side, as you can see in the histogram inset below.
A histogram should be consistent with the tones of your scene: a dark scene should produce a histogram with a bell shape on the left, while a light scene should produce a histogram with a bell shape on the right.
When it comes to daylight scenes, try to expose the scene as close to the right of the graph as possible without clipping the highlights.
How can I tell if the exposure is wrong in my histogram?
The biggest indicator is that the graph will be stacked up to the right or left on your histogram. A peak at the far left-hand side of the graph signifies that there are many pixels that are recording the darkest value black available. The implication is that your shot is most likely under-exposed.
A common error in many photos is that not enough light is received by the camera’s sensor, brought about by either a too fast shutter speed or an aperture that isn’t wide enough.
In these instances, the image’s histogram will appear pushed all the way to the left. This is what’s known as ‘clipping’. The clipped areas will look black if it’s printed, and all shadow detail will be lost.
In the same way, if the histogram appears as if it’s pushed hard to the right of the graph area, it’s probably the case that the shot is over-exposed.
When an image is overexposed this is because too much light has reached the sensor. In an overexposed image the histogram will show that the tonal distribution is pushed all the way to the right, and that the highlights are ‘clipped’. In the printed shot, parts of the scene that should be detailed will appear pure white, without detail.
How do I change the shape of the graph?
The easiest way to do this is to take an additional picture of the same object using a different amount of exposure. Take the shot with less light and the resulting graph will have shifted to left.
The graph will move to the right if you shoot with more light. Use the +/- exposure compensation control to accomplish this; a plus value shifts the histogram to the right and a negative value shifts the graph to the left.
What if the histogram is stacked to the left and the right?
This means that the scene you are shooting has both very dark shadows and very bright highlights. It is a sign of a scene with high-contrast, where the camera is going to find it impossible to locate an exposure that captures the tone and detail in all aspects of the scene.
You can sometimes avoid the problem by changing the lighting (for example, not shooting into the sun or shooting later in the day), or by using and ND grad filter to reduce the brightness of the sky.
If you must shoot, typically it’s best to change the exposure so the graph moves to the left, because it is easier to rescue the shadows than it is to rescue the highlights when you’re at the editing stage.
Is my camera’s histogram always right?
The picture is what counts, not the histogram – so make sure to look at the image too. The graph is based on the tones that would be captured by a JPEG, which means that if you are shooting raw you image will capture more detail in the highlights and shadows than the graph really shows.